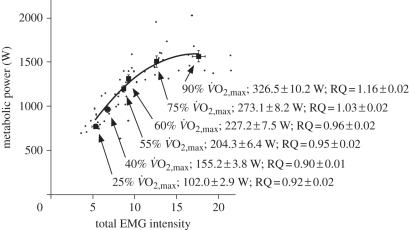
Figure 5.
Metabolic power during cycling is related to the total EMG intensity from 10 muscles in the leg. Small points show individual values for each condition, and least-squares second-order regression is fitted to these points (r2 = 0.72). The squares show the mean ± s.e.m. for the 10 subjects for each condition. Text shows the level of effort for each condition; the mechanical power output at the crank; and the respiratory quotient (RQ). Note that the RQ during cycling at levels greater than 60%  was greater than one, indicating a contribution of anaerobic metabolism; therefore, the metabolic power for these conditions has been underestimated. Nonetheless, there was a significant monotonic increase in metabolic power associated with increased EMG intensity (Spearman correlation, r = 0.86.)

