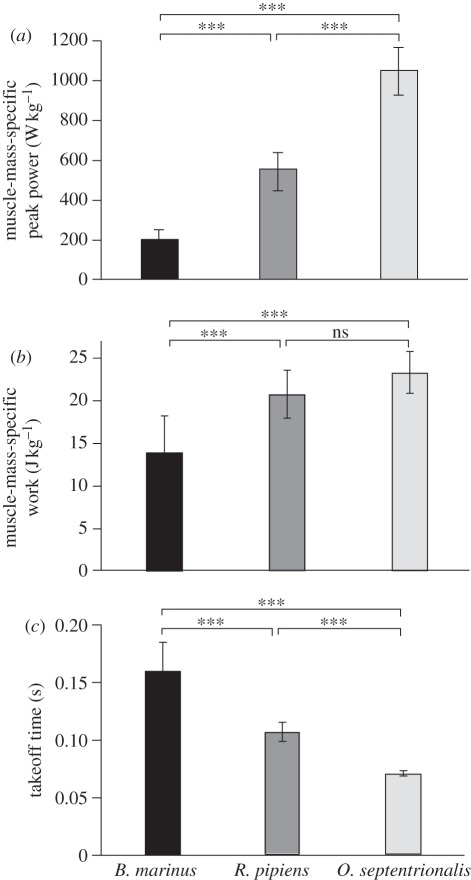
Figure 2.
Peak instantaneous power output, measured per unit hindlimb muscle mass, varied among species, with the highest powers developed by O. septentrionalis and the lowest by B. marinus (a). These differences were explained in part by differences in the total work performed (b) and in part by differences in the duration of takeoff (c). Asterisks denote significant differences (p < 0.05) between pairs indicated.

