
Figure 5.
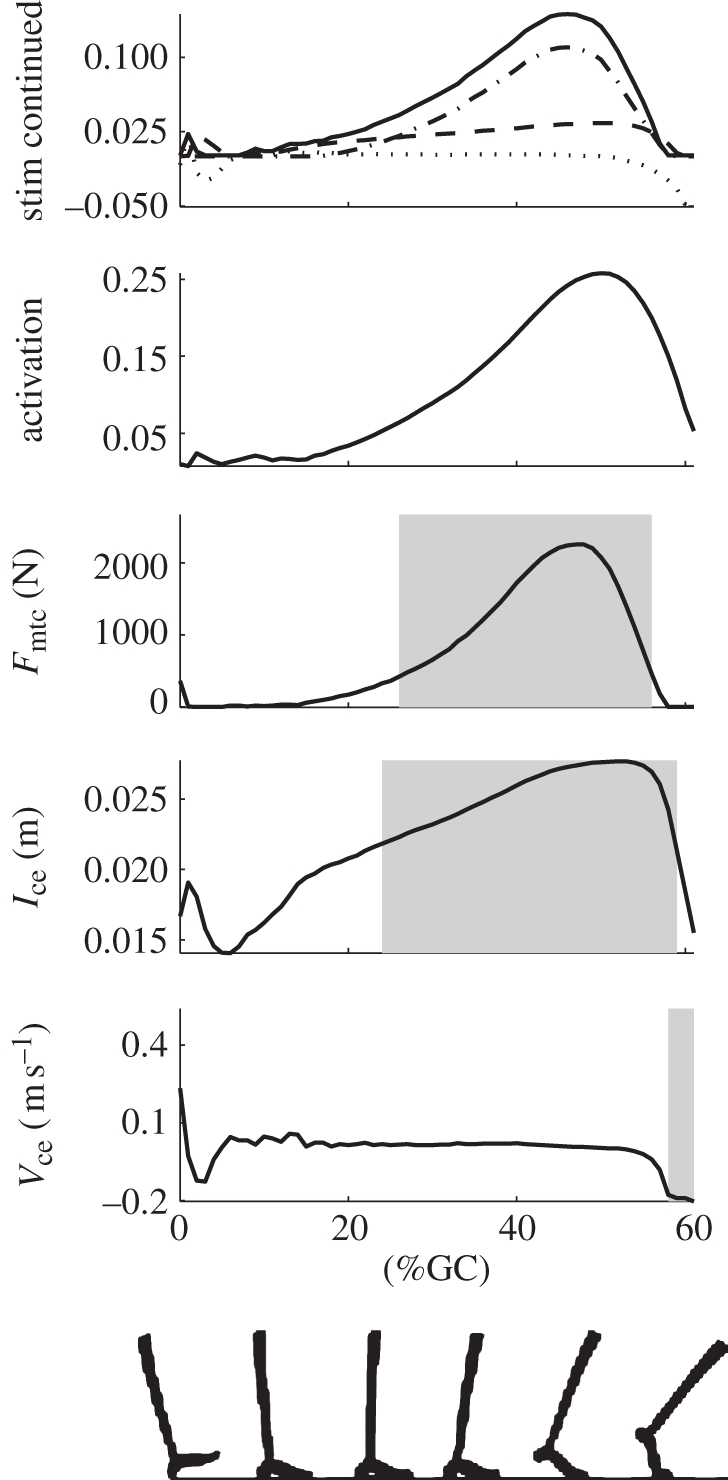
Plot of soleus muscle dynamics produced by the reflex-based stimulation (equation (2.3)) for input ankle angles from walking trials at 0.75 m s−1. The top plot shows the contributions to the stimulation (solid line) from the force (dashed-dot line), length (dashed line) and velocity terms (dotted line). The remaining plots (from top to bottom) show the total activation, muscle force, contractile element length and contractile element velocity. The shaded regions indicate the times where the force, length and velocity feedback terms contribute at least 0.01 to the stimulation.