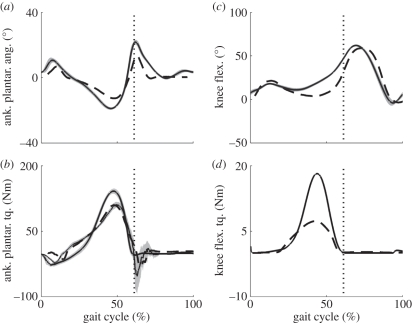
Figure 6.
Comparison of prosthesis ankle and knee angles and torques during the clinical trials (measured) with those from a height- and weight-matched subject with intact limbs (biological). Torque that plantar flexes the ankle is defined to be positive and moves the angle in the positive direction. Similarly, torque that flexes the knee is positive and increases the knee angle. The biological values are the thick solid lines (with shaded errors) in each plot while the dashed lines are the values measured on the prosthesis. In the ankle torque plot the commanded torque is shown as a thinner solid line, again with shaded error bars. The knee torque plot compares the torque provided by the clutch-spring mechanism to that provided by the natural gastrocnemius in simulation. The vertical line indicates toe off in each plot.

