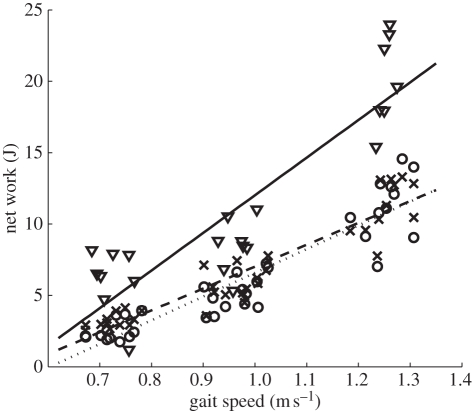
Figure 8.
Energy output of the ankle across gait speed. Shown are biological data, net work as commanded by the ankle–foot prosthesis during clinical trials and measured net work during the clinical trials. Inverted triangles, biological; crosses, commanded clinical trials; circles, measured clinical trials; continuous line, biological trend; dashed lines, command trend; dotted lines, measured trend.

