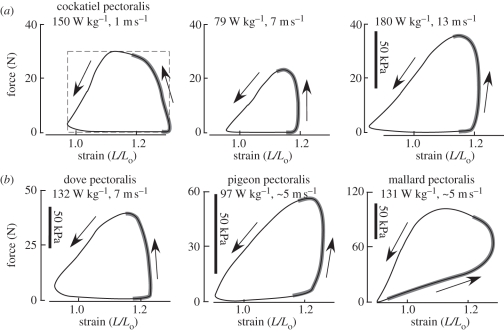
Figure 3.
Representative in vivo work-loop patterns produced by the (a) pectoralis of cockatiels (Nymphicus hollandicus) at three different flight speeds (adapted from Hedrick et al. [33]), and (b) the pectoralis of three other species: ring-neck doves (Streptopelia risoria), pigeons (Columba livia) and mallard ducks (Anas platyrynchos) (adapted from Tobalske et al. [27], Biewener et al. [31] and Williamson et al. [34]). The force produced by the muscle is plotted against its fascicle strain (L/Lo, where Lo is the muscle's resting length: strain = 1.0). In the first panel of (a), the dashed rectangle denotes the maximum work that the muscle could produce for its maximum force and strain; the realized work of the muscle is 68% of its theoretical maximum. The strain range for all muscles is the same (0.9–1.3, or 40% range of muscle length change), but force ranges differ in (b) owing to the different-sized muscles. The bold grey portion of each work loop represents the period of neuromuscular activation measured by EMG. Arrows denote the direction of force and fascicle length changes.

