
Figure 1. Brain activity for cues and targets, plotted using F-values, overlaid on several slices of the MNI normalized anatomical brain.
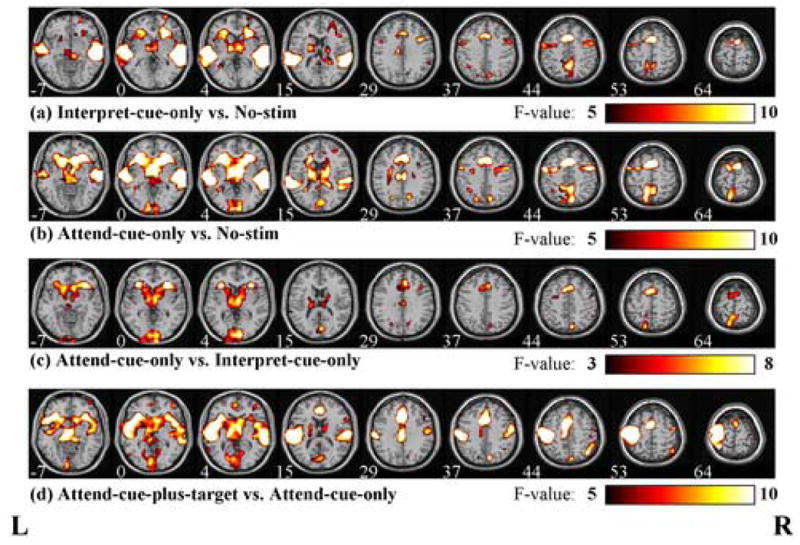
Shown is activity related to (a) cue interpretation processes (Interpret-cue-only trials vs. Nostim trials), (b) cue interpretation processes plus attentional orienting processes (Attend-cue-only trials vs. Nostim trials), (c) attentional orienting processes (Attend-cue-only trials vs. Interpret-cue-only trials), and (d) target-related process (Attend-cue-plus-target vs. Attend-cue-only trials). Nine sample slices are shown for each contrast with the Talairach Z-coordinate (mm) labeled under each slice. The color bars under each row refer to the F-values that are plotted in each of the brain slices.