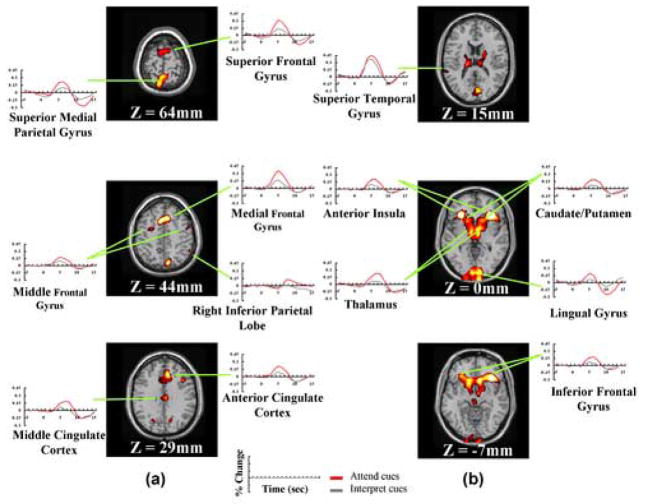
Figure 2. Attention-orienting activity in (a) dorsal brain areas and (b) ventral brain areas.
These regions were identified by contrasting Attend-cue only with Interpret-cue-only trials, after correcting for overlap using the no-stim subtraction (see Methods). Each plot depicts the average BOLD response (in units of percentage change from the corresponding baseline) across time. Note that the extracted hemodynamic responses for the Attend-cue-only trials (red solid lines) are larger than those for the Interpret-cue-only trials (gray solid line) in these regions.

