
Figure 4. Conjunction analysis revealing areas involved in spatial orienting in both the visual and the auditory modalities.
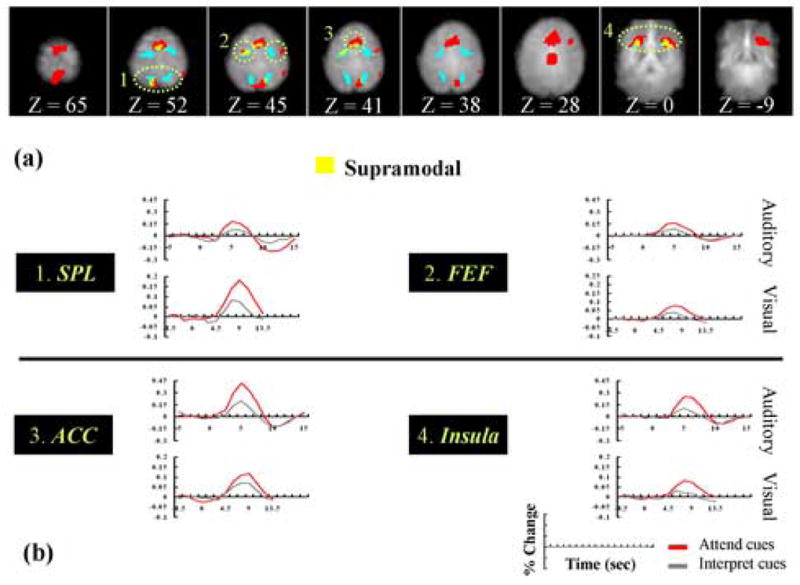
(A) Auditory-study ROIs (red), visual-study ROIs (blue) and conjunction (yellow) brain areas (supramodal regions) are indicated. The numbered light green dot-circled regions in the figure refer to 1, the superior parietal lobe, 2, the frontal eye fields, 3 the anterior cingulate cortex, and 4, the anterior insula. (B) Plots of fMRI responses in supramodal areas. Each plot depicts the average BOLD response (in units of percentage change from the corresponding baseline) across time for Attend-cue-only (red) and Interpret-cue-only (gray) trials. These responses are shown in areas that were supramodal (yellow) including the superior parietal lobe, the frontal eye fields, the anterior cingulate cortex, and the anterior insula. Note that the responses from the visual and auditory studies are plotted on different scales, due to differences in the magnetic field strength used in the two studies (i.e., 1.5 T versus 4 T, respectively).