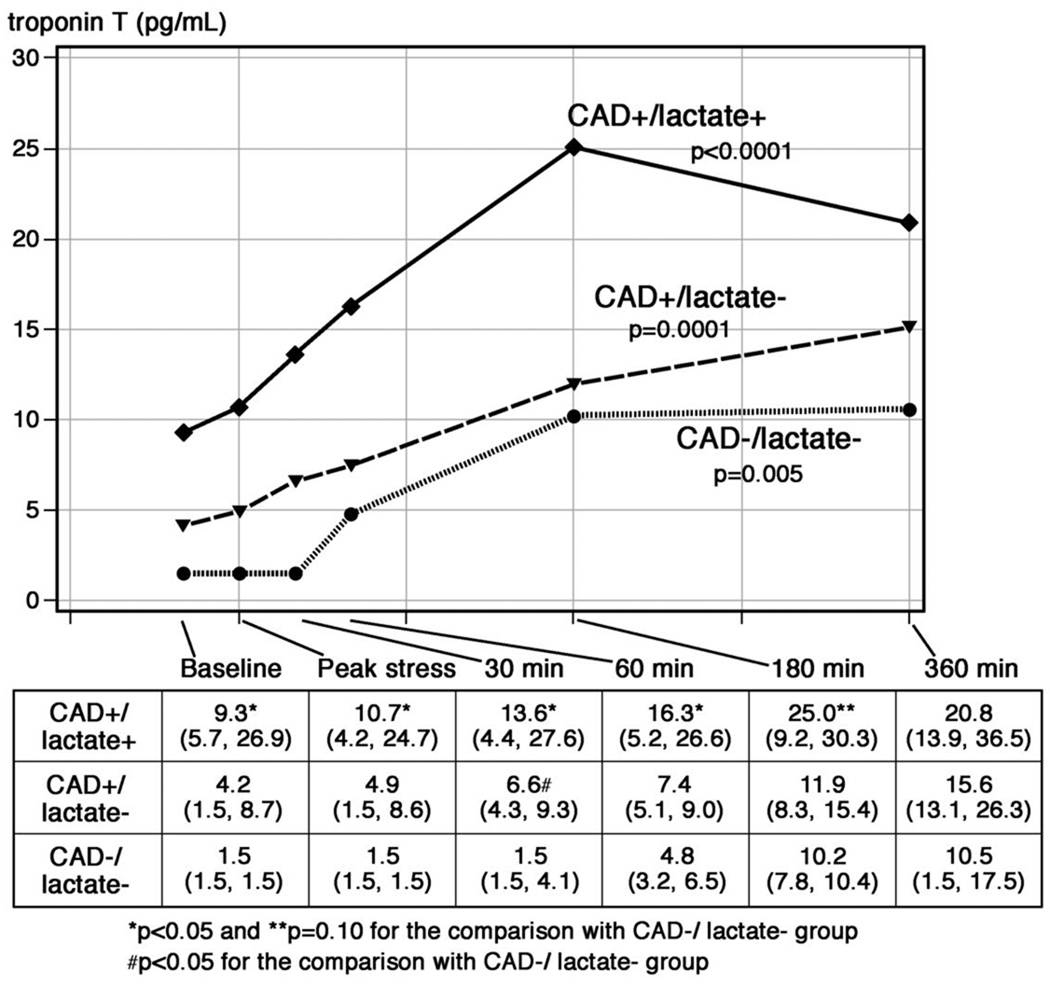
Figure 4. Median levels of cTnT in peripheral blood measured by the hs-cTnT assay following pacing-stress stratified by the presence or absence of CAD and lactate elution.
At baseline there were significant differences in cTnT concentrations between the CAD+ and CAD− groups. Following pacing, significant and similar increases were observed in each group. The p-values refer to changes in biomarker levels across timepoints for each group.

