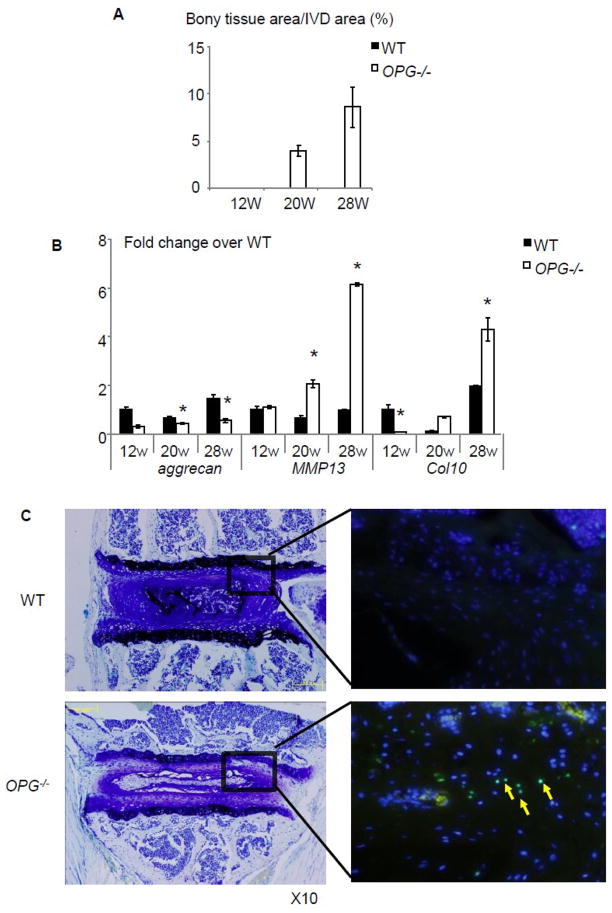
Figure 3. Impaired IVD in OPG−/− mice.
(A) Histomoprhometric assessment of newly formed bony tissues in endplate of 12-, 20- and 28-week-old WT and OPG−/− mice. Values are the mean ± SD of 3 mice. Three sections per mouse were analyzed. (B) The expression levels of aggrecan, mmp13 and Col10 mRNA in RNA extracted from IVD and endplate cartilages of 12-, 20- and 28-week-old WT and OPG−/− mice. The values are the mean ± SD of 3 independent experiments. *p< 0.05 vs. WT group. (C) TUNEL staining of IVDs of 28-week-old OPG−/− mice and WT littermates. Left photos are toludine blue stained sections and the right photos are the TUNEL stained adjacent sections. Apoptotic cells were indicated by yellow arrows.

