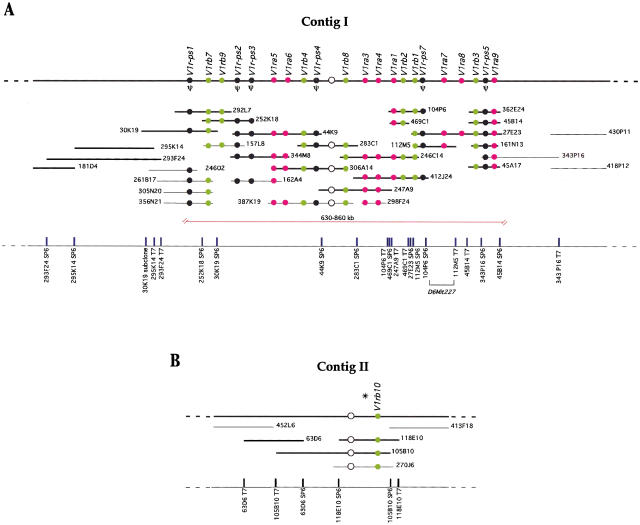
Figure 1.
(A) Physical map of the major BAC contig I on chromosome 6. The thick black line at the top of the figure represents the chromosome. The arrangement of 22 V1r genes along the cluster is shown with circles: (solid circles)V1r coding regions that have been sequenced; (empty circle) V1r gene whose order in the cluster was determined but was not cloned or sequenced; (pink circles) members of group a; (green circles) members of group b. Pseudogenes are shown in black and indicated by the symbol Ψ. BACs, with their respective names, are represented by horizontal lines below the chromosome. BACs whose sizes were estimated by pulsed-field gel electrophoresis are indicated by thick lines and drawn to scale. Estimated sizes of BACs are: 181D4, 90 kb; 293F24, 250 kb; 295K14, 160 kb; 30K19, 170 kb; 292L7, 125 kb; 252K18, 110 kb; 44K9, 200 kb; 344M8, 130 kb; 306A14, 170 kb; 283C1, 130 kb; 247A9, 160 kb; 246C14, 160 kb; 412J24, 160 kb; 104P6, 80 kb; 469C1, 45 kb; 27E23, 200 kb; 112M5, 95 kb; 363E24, 60 kb; 45B14, 60 kb; 45A17, 60 kb; 161N13, 70 kb. BACs whose sizes were not determined are indicated by thin lines and are not drawn to scale. The red bracket below the BACs indicates the estimated extent of the V1r cluster. The positions of the BAC end sequences are indicated at the bottom as the name of the BAC clone followed by the SP6 or T7 side of the BAC vector. (B) BAC contig II on the X chromosome. The thick black line at the top of the figure represents the chromosome. V1r genes are represented by circles: (solid circle) sequenced V1rb10 gene. The green color indicates that it belongs to group b. (Open circle) V1r gene that cross-hybridizes weakly with pool #1 probe by Southern blot hybridization but was not cloned and sequenced. The asterisk above the neighboring V1r genes indicates unknown marker order. BACs whose sizes were estimated by pulsed-field gel electrophoresis are indicated by thick lines and drawn to scale. Estimated sizes of BACs are: 63D6, 130 kb; 105B10, 250 kb; 118E10, 130 kb. BACs whose sizes were not determined are indicated by thin lines and are not drawn to scale. The positions of the BAC end sequences are indicated at the bottom as the name of the BAC clone followed by the SP6 or T7 side of the BAC vector.

