
Figure 3.
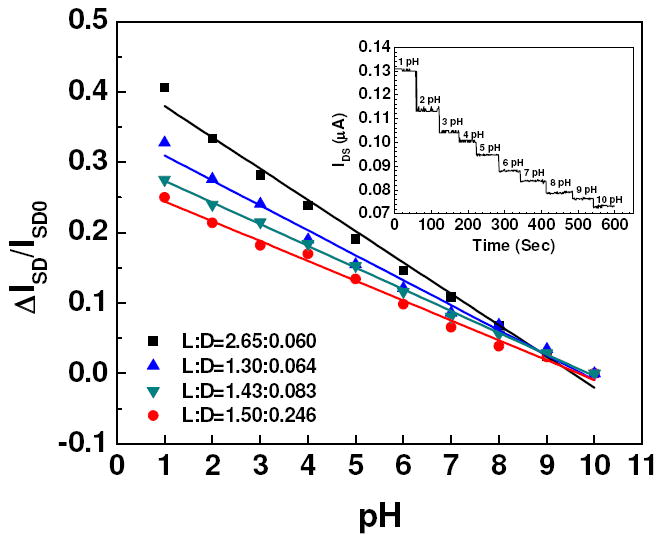
pH calibration curve of single Ppy nanowire for four representative aspect ratio (L:D, microns) at VG = 0 V with VDS = 0.5 V. Solid lines represent the best linear fit for the data points. (Inset) Real-time pH sensing response of a single Ppy nanowire device.