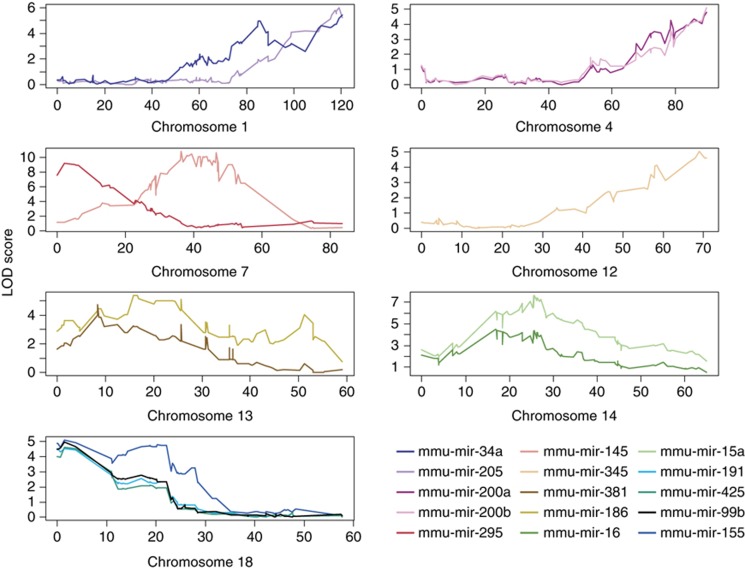
Figure 1.
Top 15 microRNA expression quantitative trait loci (eQTL) plots. X-axis represents genomic coordinates in basepairs. Results shown are from the initial genome-wide scan. Of those shown, eQTLs on chromosome 18 for mmu-miR-99b, mmu-miR-191, and mmu-miR-425 were not replicated when prior knowledge of the eQTLs of the respective target mRNAs were incorporated into the linkage analysis.

