Fig. 12.

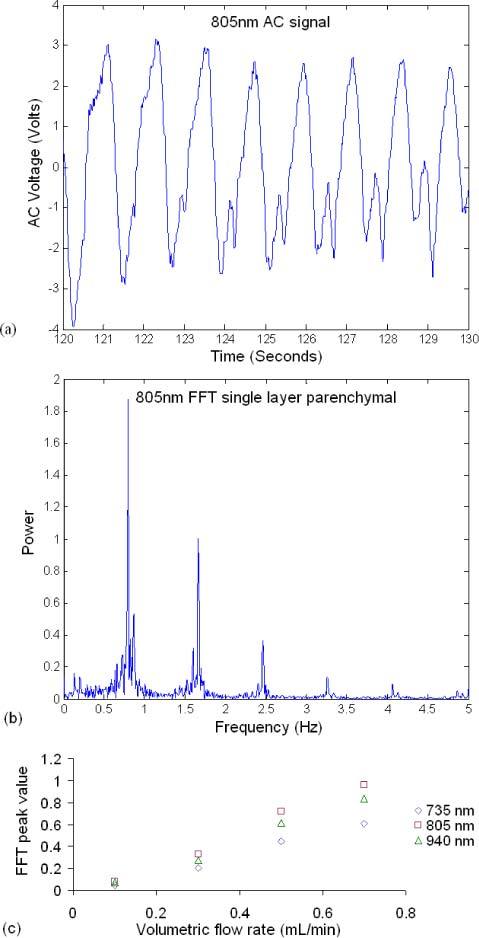
(a) 10-second segment of the time domain AC signal measured from the single layer parenchymal phantom, (b) corresponding FFT spectrum of (a), and (c) FFT value at 1.667 Hz vs. volumetric flow rate.

(a) 10-second segment of the time domain AC signal measured from the single layer parenchymal phantom, (b) corresponding FFT spectrum of (a), and (c) FFT value at 1.667 Hz vs. volumetric flow rate.