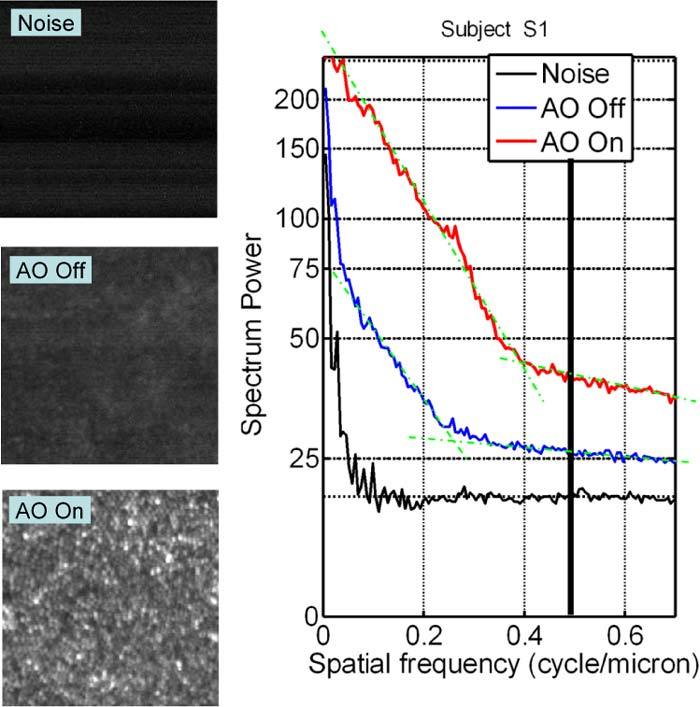
Fig. 8.

Comparison of noise (no eye in system), foveal images with and without AO. The image inserts are each 256 × 256 pixels, and the AO-Off image display has been scaled in intensity by 2 × relative to the AO-On image. The right panel is the Fourier spectral power plot for each of the image conditions. The vertical black line represents the ideal MTF cutoff frequency of this system, and the green dot-dash lines were added for showing the trends of the power spectral curves.
