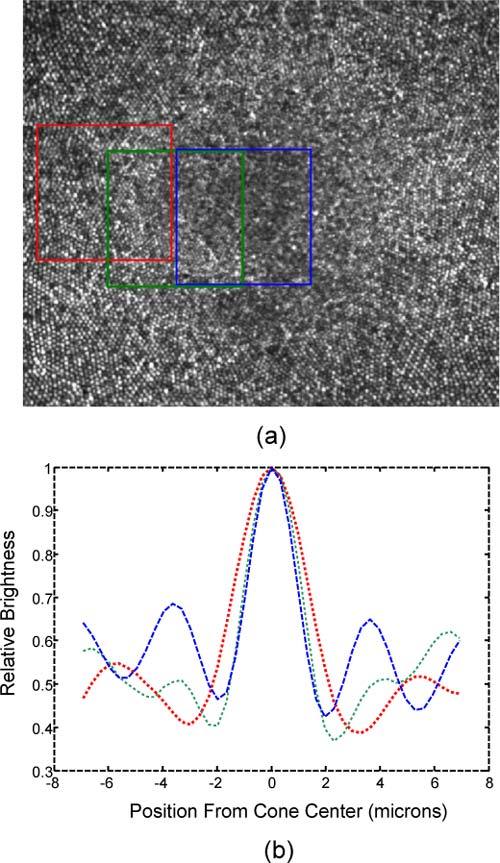
Fig. 14.

(a) Cone photoreceptor images of Subject S2 with Φ25 µm confocal pinhole and (b) their averaged intensity profiles. These are the image brightness cross-section profiles of cones at three distances from the fovea, which are the estimated PSFs for a Φ7.56 mm pupil as the sample window is moved from about 120 µm eccentricity (red box and curve) to the foveal center (blue box and curve).
