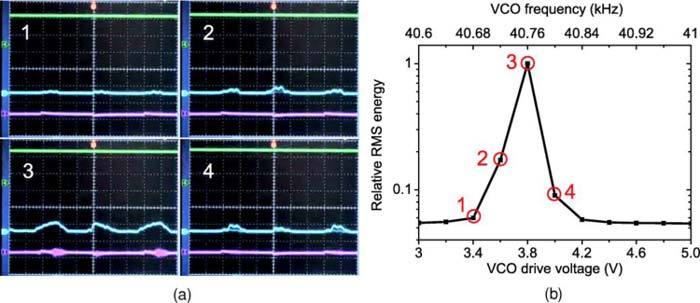
Fig. 3.

(a) Oscilloscope snapshots (Media 1 (2.1MB, MOV) ) at points marked in (b) showing VCO drive voltage (green), photodiode output (cyan) and MZI output (magenta); (b) Evolution of optical energy with VCO drive voltage (lower horizontal axis) and the corresponding output frequency (upper horizontal axis).
