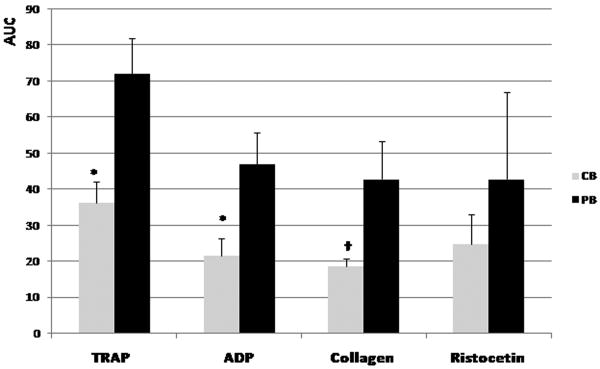
Figure 4.
Impedance platelet aggregometry results obtained with the Multiplate system, following stimulation with thrombin receptor-activating peptide (TRAP), ADP, collagen, and ristocetin. Gray bars represent non-manipulated cord blood (CB) samples and black bars represent non-manipulated adult peripheral blood (PB) samples (mean ± standard deviation of seven independent samples per group). AUC, area under the curve. *P < 0.001; †P < 0.01.

