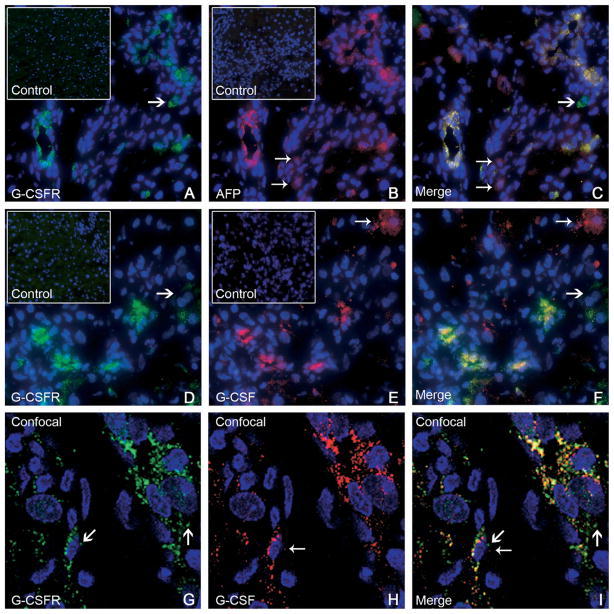
Figure 2.
(A–C) Double-immunofluorescence staining of livers from group C (11 days after 2AAF/PH) showed expression of (A) G-CSFR (green), (B) AFP (red), and (C) co-expression (yellow) by many periportal cells. A few cells expressed AFP alone (small arrows, 2B and 2C), or G-CSFR alone (large arrows, 2A and 2C). The inserts in A and B represent isotype controls for G-CSFR and AFP, respectively. Cell nuclei were stained with DAPI (blue). Original magnification, 40× objective. (D–F) Double-immunofluorescence staining of livers from group C (11 days after 2AAF/PH) detected cells expressing (D) G-CSFR (green), (E) G-CSF (red), and (F) co-expression (yellow) in many periportal cells. A few cells expressed G-CSFR alone (large arrows, 2D and 2F) or G-CSF alone (small arrows, 2E and 2F). The inserts in D and E represent isotype controls for G-CSFR and G-CSF, respectively. Cell nuclei were stained with DAPI (blue). Original magnification, 40× objective. (G–I) Confocal microscopy was used on representative sections from the same animals (group C). Immunofluorescence for (G) G-CSFR (green) and (H) G-CSF (red) shows (I) co-expression (merge) within many periportal cells. The presence of dual markers (yellow) is evident in most cells shown. Both G-CSFR and G-CSF also were seen as distinct colors in separate cellular domains, denoting differential distribution within the cell (large arrows and small arrows, respectively). Cell nuclei were stained with DAPI (blue). Original magnification, 63× objective.

