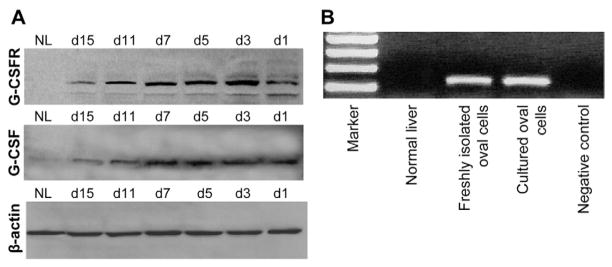
Figure 3.
(A) Western blot analysis of liver homogenates confirmed the expression of both G-CSF and G-CSFR after 2AAF/PH in rats (at days 1, 3, 5, 7, 11, and 15 after surgery) vs normal liver (NL). G-CSFR was not produced by NL, whereas its expression was induced after OC activation, with a peak at days 3–7 after PH. G-CSF production also was increased after 2AAF/PH, peaking at days 5–7 after PH. (B) RT-PCR amplification of G-CSFR mRNA in normal liver, freshly isolated OCs, and cultured OCs provide further proof of the expression of G-CSFR by hepatic OCs.

