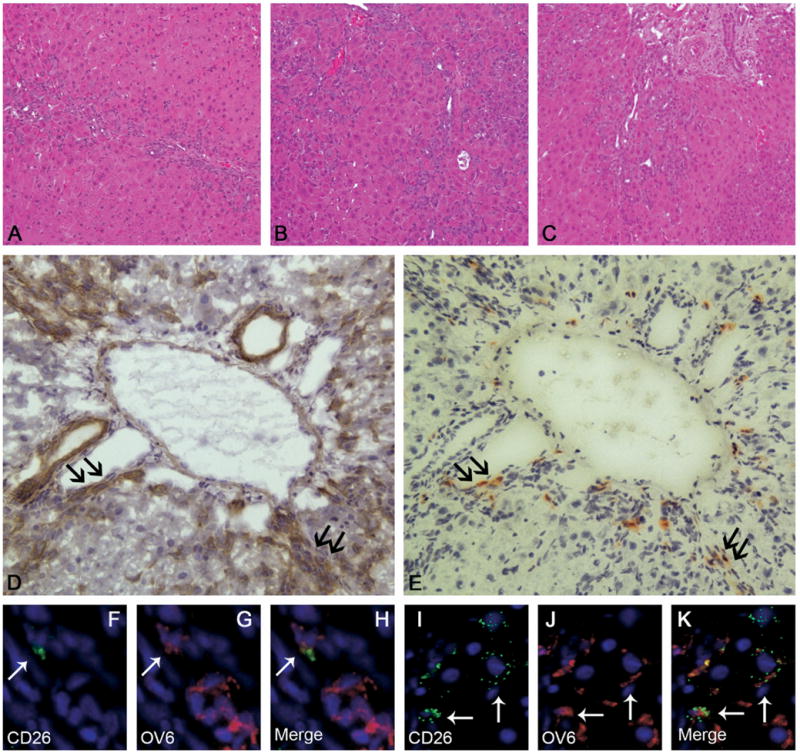
Figure 4.

H&E staining of liver sections 11 days after 2AAF/PH in (A) control animals (group C), (B) after G-CSF treatment (group B), and (C) after Peg–G-CSF administration (group A). At the peak of the OC reaction, the number of OCs was significantly higher in animals treated with G-CSF or Peg–G-CSF as compared with controls. Original magnification, 10× objective. (D and E) Representative serial sections stained for OV6 and DPPIV in the liver of a BMTx/2AAF/PH rat treated with exogenous G-CSF (group A). The expression of DPPIV represents a specific marker of BM donor–derived cells. (E) Right panel shows expression of DPPIV on many small, periportal cells (red–orange). (D) The corresponding serial section depicted in the left panel shows that many of the DPPIV+ cells also express the OC marker OV6 (brown), and therefore may be considered BM-derived OCs. Black arrows indicate the same cells on each figure. Original magnification, 20× objective. (F–K) Double-immunofluorescence staining of liver from group A (11 days after 2AAF/PH) detected cells expressing (anti-DPPIV, 4F and 4I, green) CD26, (4G and 4J, red) OV6, and (4H and 4K, yellow) co-expression in many periportal cells (⇐). Cell nuclei were stained with DAPI (blue). Original magnification, 40× objective.
