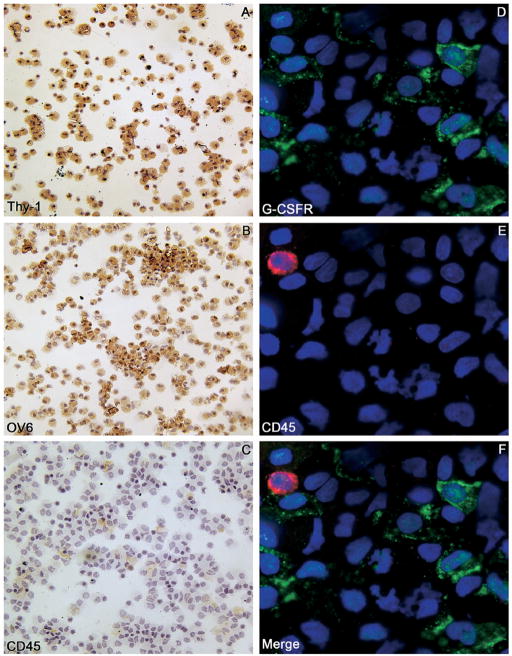
Figure 7.
(A–C) Thy-1+ sorted cell cytospins stained for (A) Thy-1, (B) OV6, and (C) CD45. Most of the sorted cells were OV6+ and Thy-1+, whereas a very few hematopoietic cells (CD45+) were observed. (D–F) Double-immunofluorescence staining of Thy-1+ sorted cell cytospins show (D) G-CSFR (green) and (E) the hematopoietic marker CD45 (red). Numerous Thy-1+ cells expressed G-CSFR (~59%), whereas the degree of hematopoietic cell contamination was negligible. (F) The merge of panels D and E showed that the few CD45+ cells were G-CSFR−. Cell nuclei were stained with DAPI (blue). Original magnification, 100× objective.

