
FIGURE 3.
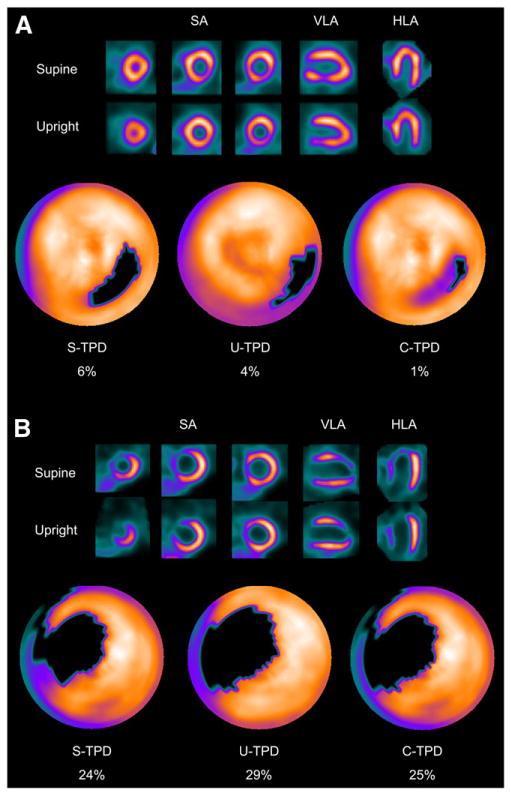
(A) Example of inferolateral wall supine and upright MPS artifact images from 49-y-old woman with typical chest pain and known hypertension, diabetes, hypercholesterolemia, and family history of premature CAD. Images are displayed in 3 short-axis views and in vertical and horizontal long-axis views. Electrocardiogram response to exercise was nonischemic for ST-segment depression. Poststress supine and upright images show reduced uptake of radiotracer in inferolateral wall (top and middle rows). Blackout maps (bottom row) give quantification results of 4% for U-TPD and 6% for S-TPD. When supine and upright images are combined, only a small defect is visualized on black-out map, with C-TPD of 1%. Subsequent coronary angiogram showed no significant stenosis. (B) Example of true anteroseptal wall defect on supine and upright MPS images from 43-y-old man with typical chest pain and known hypercholesterolemia. Electrocardiogram response to exercise was ischemic for ST-segment depression, and subsequent coronary angiogram revealed severe stenosis of proximal left anterior descending coronary artery. Both supine and upright images show apparent anteroseptal wall perfusion abnormality, and U-TPD, S-TPD, and C-TPD are 29%, 24%, and 25%, respectively. Defects are visualized on black-out maps. HLA = horizontal long axis; SA = short axis; VLA = vertical long axis.