
FIGURE 4.
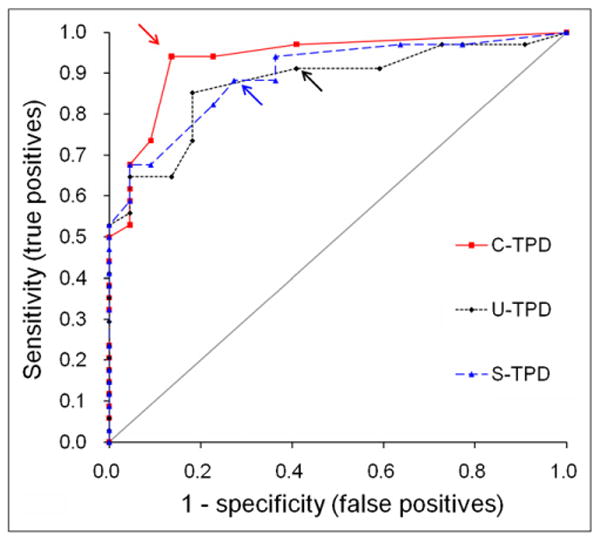
ROC curves for detection of CAD by measurements of U-TPD, S-TPD, and C-TPD in angiographic population (n = 56). Percentage TPD was compared with presence or absence of hemodynamically significant CAD as observed by ICA. U-TPD ≥ 5%, S-TPD ≥ 5%, and C-TPD ≥ 3% were used as cutoff points.