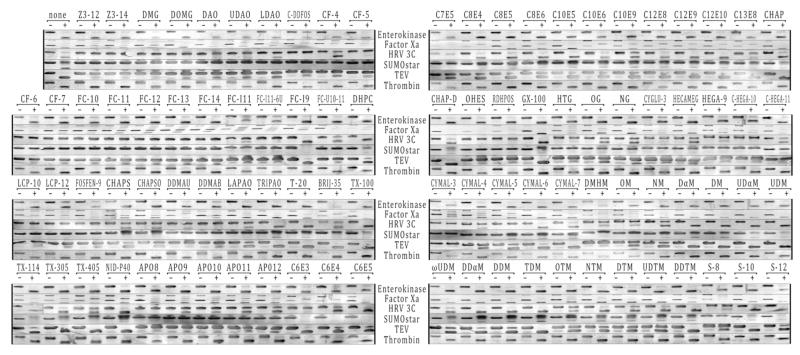
Figure 1.
Gel lanes for each protease experiment are shown above labeled “–” for no protease and “+” for protease present. The abbreviations for the detergents are given in Table 2. The rows were cut out from scanned images of the 48-well blots and their contrast was adjusted automatically within Adobe Photoshop CS2. All control protease control proteins showed a simple gel shift after digestion with the exception of the Factor Xa control protein which formed SDS-resistant oligomers. These oligomers did not prevent analysis of the results. The amount of digestion was estimated from the amount of digested protein formed in the protease “+” lane compared to the protease “–” lane and assigned a value of “+++, ++, +, or –”. The image for TX-114 for HRV3C was repeated from another blot due to a bubble in the original transfer.

