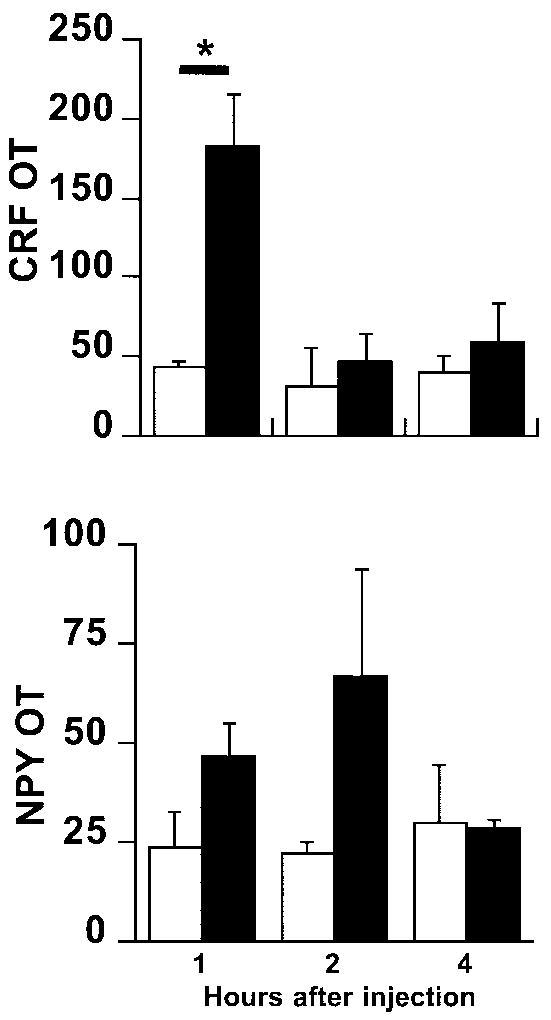
Fig 2.
Dark field analysis of silver grains expressed in unit-less values of optical transmission (OT). Top, CRF mRNA levels (ANOVA, p<0.05 treatment); bottom, NPY mRNA levels (ANOVA, p<0.05 treatment) following an acute PVN injection of fenfluramine (200 nmol/0.5 μl/side). Black bars = fenfluramine; white bars = vehicle; * = p<0.03 (Fisher’s test), n = 4-5/group.

