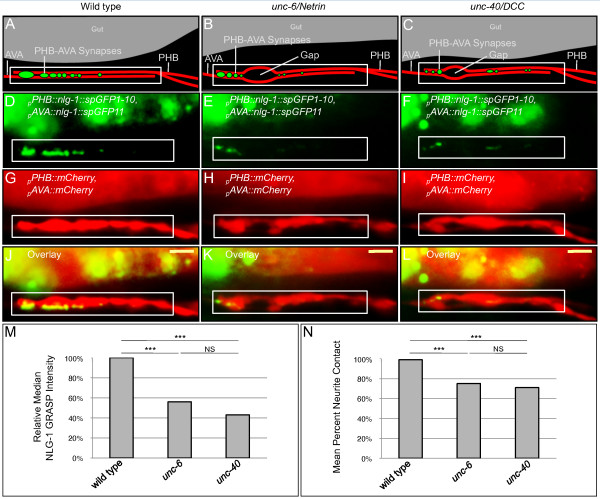
Figure 2.
unc-6 and unc-40 mutants display defective SPR. (A) Schematic and (D,G,J) micrographs of a wild-type animal. (D) The NLG-1 GRASP signal indicates synapses between PHB and AVA neurons. (G) mCherry labels PHB and AVA neurites and shows nearly complete contact. (J) Merged image. (B) Schematic and (E,H,K) micrographs of an unc-6 mutant animal. (E) The NLG-1 GRASP signal is severely reduced. (H) Minor defects in neurite contact are visualized as small gaps between mCherry-labeled neurites. (K) Merge. (C) Schematic and (F,I,L) micrographs of an unc-40 mutant. (F) The reduced NLG-1 GRASP signal is similar to that in unc-6 animals. (I) Minor defects in PHB and AVA neurite contact are also similar. (L) Merged image. Yellow scale bar: 2 μm. (M) Quantification of reduction in NLG-1 GRASP fluorescence in unc-6 and unc-40 mutants using NIH ImageJ. Wild-type n = 94, unc-6 n = 87, and unc-40 n = 85 animals. ***P < 0.001, NS, not significant, u-test. P-values were adjusted for multiple comparisons using the Hochberg method. (N) Quantification of contact defects between PHB and AVA neurites using NIH ImageJ. Wild-type n = 94, unc-6 n = 87, and unc-40 n = 85 animals. ***P < 0.001, NS, not significant, t-test. P-values were adjusted for multiple comparisons using the Hochberg method.

