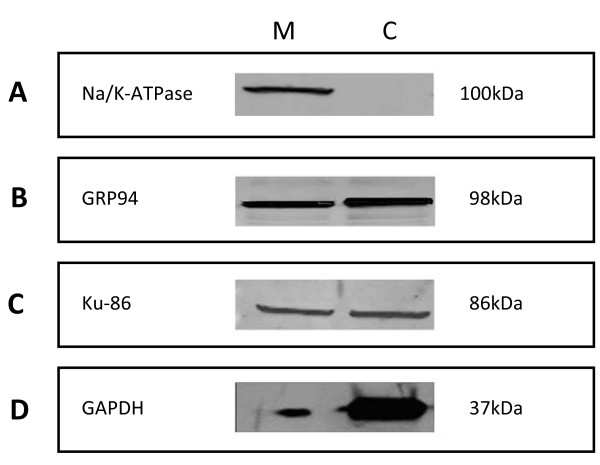
Figure 1.
Evaluation of the purity of the cell membrane isolation method. Cells were subjected to crude isolation of Membrane (M) and Cytosol (C) fractions. Western blot analysis of the different markers - (A) Na/K-ATPase (plasma membrane), (B) GRP94 (endoplasmic reticulum), (C) Ku86 (nuclear) and (D) GAPDH (cytosol). (M) Membrane, (C) Cytosol and (Mw) molecular weight marker (kDa).

