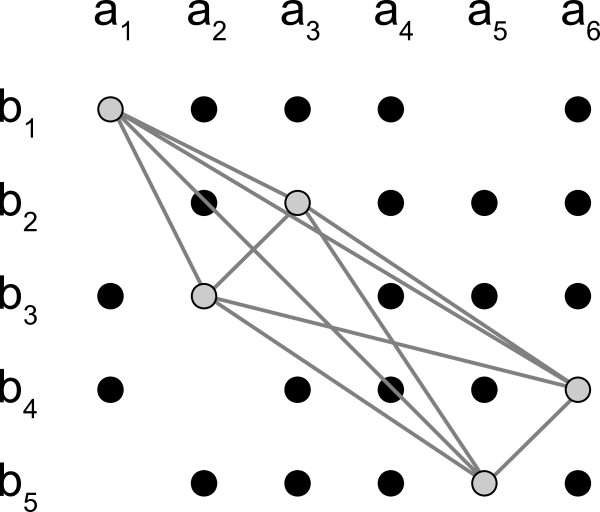
Figure 4.
Example compatibility graph. Example compatibility graph for two protein families A = {a1 ... a6} and B = {b1 ... b5}. Circles are vertices representing an ai to bj protein pair from matching species. The grey vertices are pairs that will form a match of size 5 if all 10 connecting edges (also in grey) are compatible with each other. Edges between vertices not included in the maximum clique are omitted for clarity.

