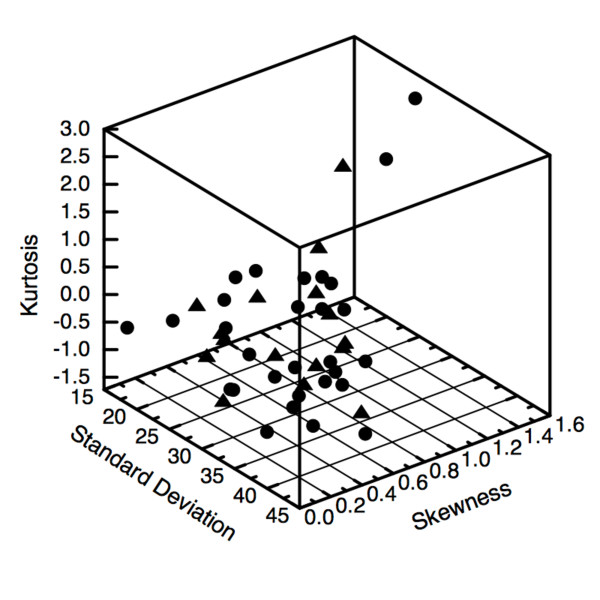
Figure 6.
Quantifier phasespace. A phase space of intuitive, non-spatial quantifiers of heterogeneity is shown. Each point has a standard deviation, skewness and kurtosis coordinate. As is evident in the plot, and confirmed via principal component analysis, there is no delineation between patients who underwent successful (circles) or unsuccessful (triangles) radiotherapy.

