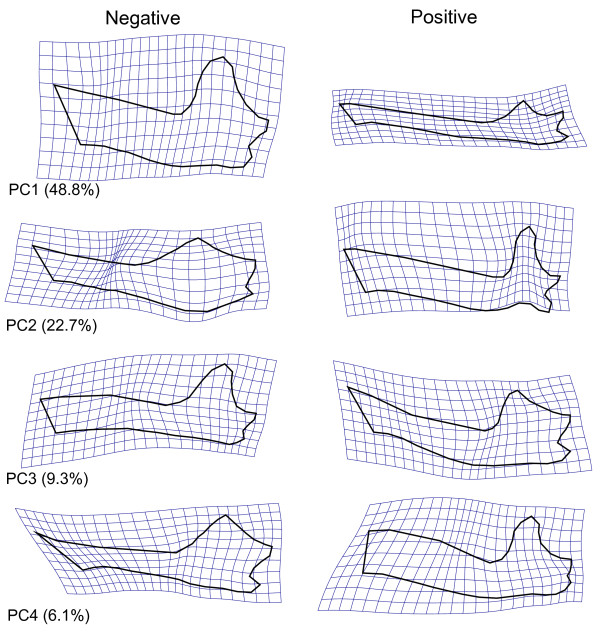
Figure 4.
Mandible shape variation associated with Principal Components. Shape icons depicted as grid deformations relative to the grand average shape (Fig. 2B). Shape changes correspond to maximum observed range of scores. Numbers in parentheses indicate the amount of total shape variation explained by each PC.

