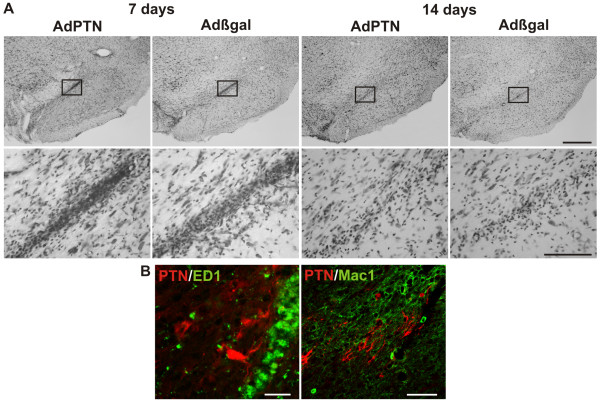
Figure 4.
Inflammatory response after adenoviral infection. (A) Inflammatory infiltrate induced by the adenoviruses as seen in Nissl stained sections in normal rats. The coronal sections correspond to the same Paxinos and Watson stereotaxic atlas plate shown in Figure 3A (right). The infiltrate has a similar extension in Adβgal and AdPTN injected rats and was higher at 7 than 14 days after injection. Scale bars: 500 μm (low magnification images) and 100 μm (high magnification images). (B) Microphotographs showing activated macrophages labeled with antibodies against ED1 (left) or Mac1 (right), in double labeling with PTN (red). Scale bars: 50 μm.

