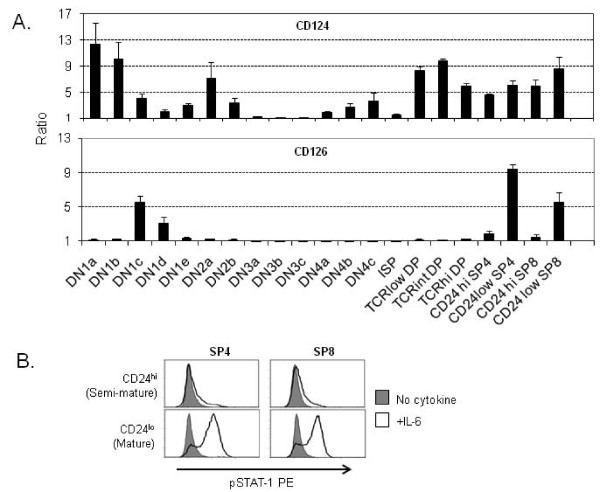
Figure 3.
Surface expression of CD124 and CD126, and IL-6 signaling. The 10-color flow cytometric staining scheme shown in Figure 2 was used to evaluate expression of the cytokine receptors CD124 and CD126 (A). The FSC-adjusted MFI values for each receptor-specific stain were divided by the MFI values obtained from each corresponding isotype control stain to generate the ratios shown in the graph. A ratio of 1 indicates no change compared to isotype control. Bars represent the average MFI values from ten separate experiments and the error bars represent SD. Ten million cells were stained for each experiment shown in (A). In (B), surface staining of CD4, CD8 and CD24 was used to sort CD24loSP4, CD24hiSP4, CD24loSP8, and CD24hiSP8 populations. Sorted cells were subsequently treated with (open histograms) and without (shaded histograms) 25 ng/ml IL-6 as described in the methods section. Inducible IL-6 signaling was assessed by intracellular pSTAT-1-PE staining. The assay in (B) is representative of three experiments. 250,000 sort-purified cells from each indicated subset were used for the experiment shown.

