Figure 3.

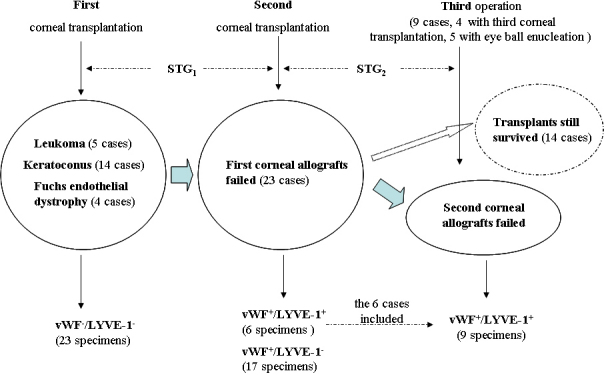
Schematic diagram of survival time of grafts (STG), hemangiogenesis and lymphangiogenesis detected at different times following corneal transplantation.

Schematic diagram of survival time of grafts (STG), hemangiogenesis and lymphangiogenesis detected at different times following corneal transplantation.