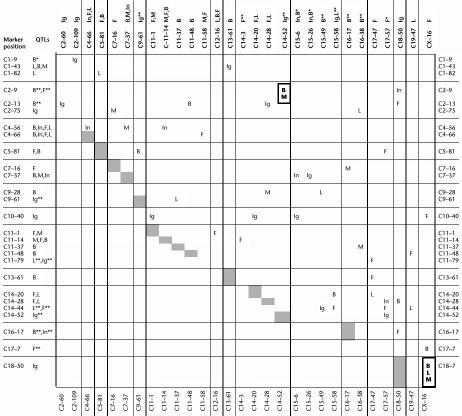
Table 7.
Traits Affected by Interaction between Loci that Directly Influence One of the Traits
This is a condensed contingency table of 49 QTL-linked markers that were included in the interaction analysis. It shows affected traits by pairwise locus interaction. Empty columns and rows resulting from markers that did not contribute any significant interaction effect were omitted from the complete contingency table. Grey cells are on the diagonal of the full contingency table. Marker positions are given as chromosome number and (cM) position (e.g., C1–9 for D1Mit68). Behind the marker positions, the traits are given that have direct effect at the marker position (see Table 5). * indicates traits with nonsignificant effect in this study but which were significant in the cross DU6xDUKs (Brockmann et al. 1998). ** indicates traits that suggest effects but did not reach the 0.1 significance threshold in this study. All listed markers have at least interaction effect together with one other marker (i.e., QTL-linked markers were omitted entirely if they were not involved in any interactions). Locus*locus interactions that influence two or more traits are marked bold.
B, body weight; F, abdominal fat weight; M, muscle weight; L, leptin; In, insulin; Ig, IGF-I.

