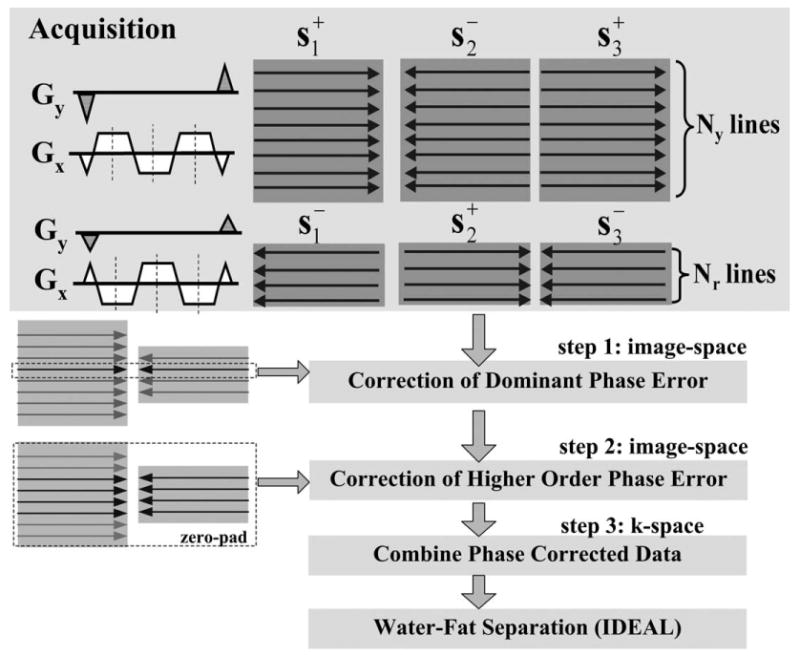
Figure 1.

Acquisition strategy and flow diagram of the 2D phase and amplitude correction algorithm. During the acquisition, additional phase encoded reference lines (Nr) are collected but with the reversed gradient polarity at each echo. Each line represents one k-space phase encoded line, and the direction of the arrows indicates the gradient polarity used. During the reconstruction, the pair of center k-space lines collected with opposite gradient polarities is used for estimating a linear dominant phase error in the read-out direction. The remaining high order phase errors are corrected using the pair of low-resolution images reconstructed from the center Nr lines. Finally, the phase corrected reference lines are combined with the regular data to form the final multi-echo data, which are then processed by the IDEAL algorithm to separate water and fat.
