
Figure 4.
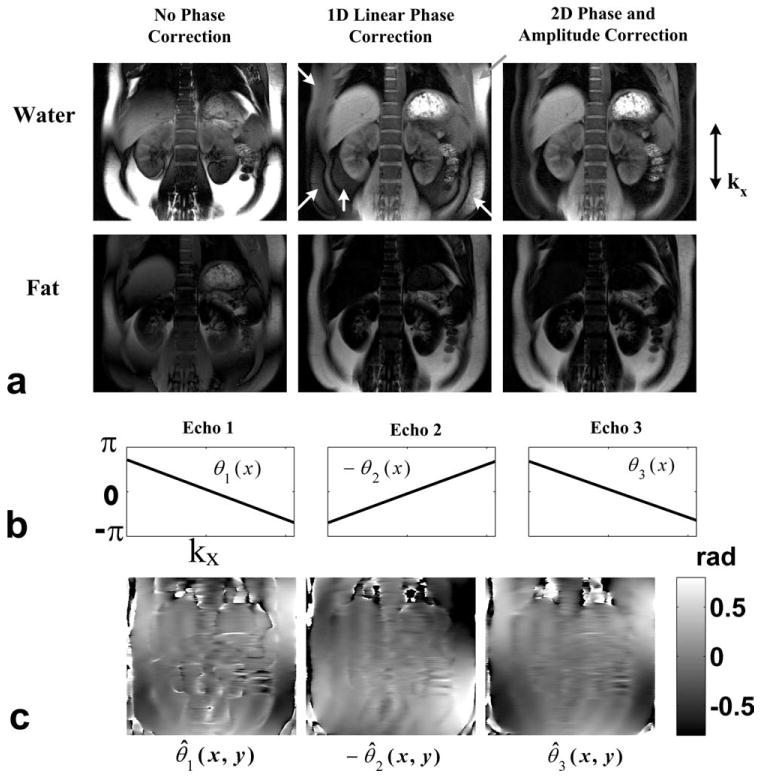
Results from an in vivo abdominal scan. a: Water and fat images from IDEAL water–fat separation after no phase correction, 1D linear phase correction, and the proposed 2D phase and amplitude correction (Nr = 16), respectively. b: The dominant linear phase error estimated at the 3 echoes. c: The low-resolution 2D phase errors suggest the strong presence of high order effects.