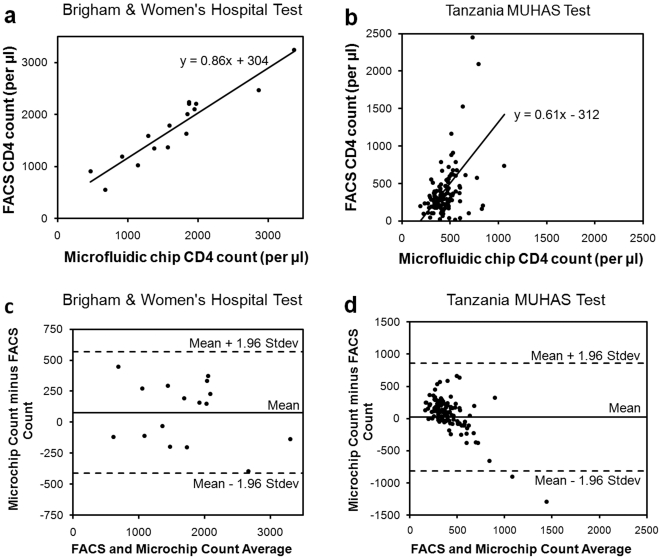
Figure 4. Comparison of microchip and Fluorescent Activated Cell Sorting (FACS) CD4+ T-lymphocyte counts for HIV-infected patient whole blood samples.
The measurements were performed at BWH (Brigham and Women's Hospital, Boston, MA) and MUHAS (Muhimbili University of Health and Allied Sciences, Dar es Salaam, Tanzania). FACSCalibur counts were used as the gold standard to compare and validate the microchip counts. (a) Microchip measurements highly correlated with FACSCalibur measurements when conducted at an established hospital setting at BWH (y = 0.86x+304, correlation coefficient: 0.94, p<0.01). (b) When the microchips were shipped to Tanzania and the measurements were performed at MUHAS, a correlation between the microchip CD4 counts and the FACS counts were observed (y = 0.61x+312, correlation coefficient: 0.49, p<0.01). (c) Bland-Altman Analysis between the microchip and FACS counts did not display an evidence for a systematic bias for BWH measurements. The mean bias was +76 cells per µL of blood in microchip counts compared to FACS counts at BWH. (d) Bland-Altman Analysis showed a bias towards higher measurements in MUHAS results, while the mean bias was as low as +23 cells per µL of blood in microchip counts compared to FACS counts.

