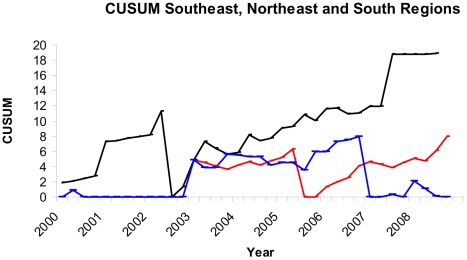
Figure 1. CUSUM analysis done for thalidomide embryopathy phenotype for southeast (black line), northeast (red line), and south (blue line) Brazilian regions.
Parameters: Southeast region (K = 0.8 H = 10 ARL = 518 OOCARL = 44.4); northeast region (K = 0.4 H = 5.6 ARL = 473 OOCARL = 44.2); and south region (K = 1 H = 8 ARL = 462.1 OOCARL = 36.4).

