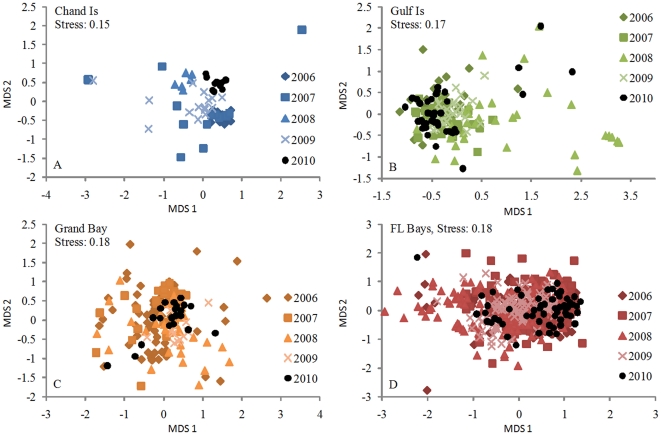
Figure 3. Community composition of seagrass-associated fish communities, 2006–2010.
Multi-dimensional scaling plots for seagrass-associated fish communities prior to (2006–2009; colored symbols) and following (2010; black circles) the DH spill. Data for (A) Chandeleur Islands, (B) Gulf Islands, (C) Grand Bay and (D) Florida Bays are presented separately. Each datum represents a single trawl sample.

