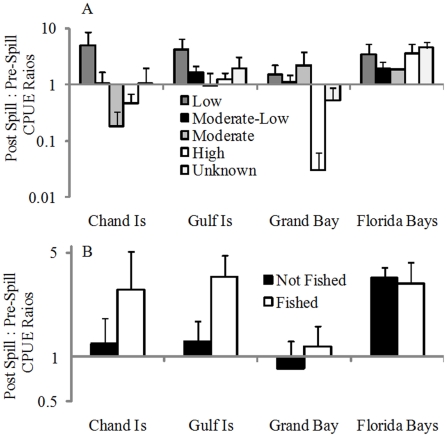
Figure 4. Larval risk and fishery closure impacts.
Effects of (A) egg/larval vulnerability and (B) harvest pressure on the responses of fishes to the DH spill. Response of individual species calculated as the ratio of 2010 versus 2006–2009 CPUE data. Data are presented on a log scale as group means (μ + 1SE), with ratios >1 indicating that 2010 catch rates were elevated relative to 2006–2010 data.

