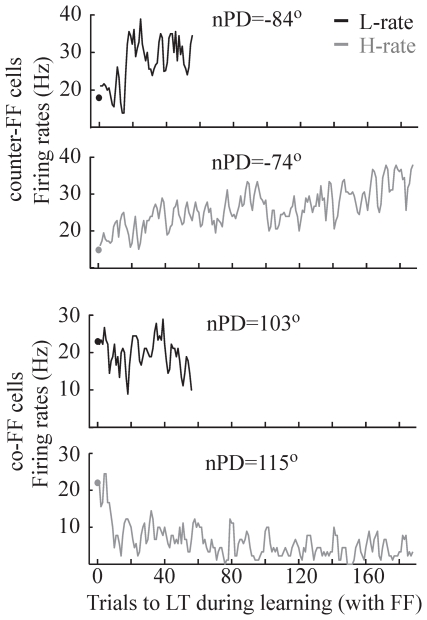
Figure 4. The activity of four different single cells in the L-rate condition (black) and H-rate condition (grey) on the first learning day as a function of trial number.
The figure depicts (from top to bottom): a counter-FF cell recorded under the L-rate (nPD = −84°), a counter-FF cells recorded under the H-rate (nPD = −74°), a co-FF cell recorded under the L-rate (nPD = 103°) and a co-FF cell recorded under the H-rate (nPD = 115°). For each cell (trace) the figure shows average firing rate across standard trials to the learned target (circle) and firing rates along the learning trials to the learned target.

