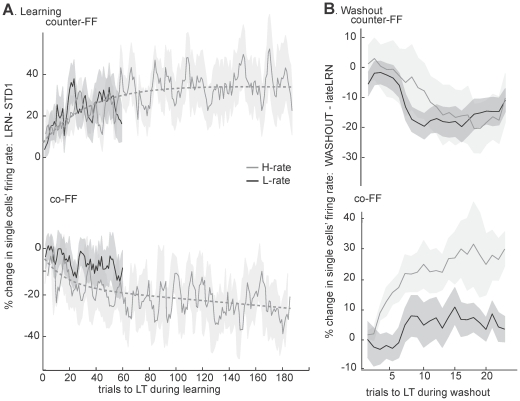
Figure 5. Different dynamics in counter-FF and co-FF cells under L-rate and H-rate as a function of trial number.
Figure depicts analyses of cells with PDs in the range −135°<nPD<−45° (counter-FF, top) and range 45°<nPD<135° (co-FF, bottom) (A)Dynamics of changes in activity during adaptation trials to the learned target (LT) relative to standard trials in the first learning day. Counter-FF cells showed increased activity (p<0.01) under L-rate (number of cells = 29) and H-rate (number of cells = 17), with similar magnitudes (p>0.5) in the two conditions, for the same number of trials. In contrast, co-FF cells showed a significant decrease in activity only under H-rate (number of cells = 21, p<0.01), whereas changes under L-rate (number of cells = 36) were not significant (p>0.1). (B)Changes in activity in movements to the learned target along washout (standard trials) relative to activity on the last 10 force-field trials. Counter-FF cells decreased their activity significantly (p<0.01) and similarly under H-rate as compared to L-rate (number of cells = 18 and 33, respectively. p>0.5). Co-FF cells showed a significant increase only under H-rate (number of cells = 13, p<0.01) but not under L-rate (number of cells = 23, p>0.1). Shaded areas denote SEM.

