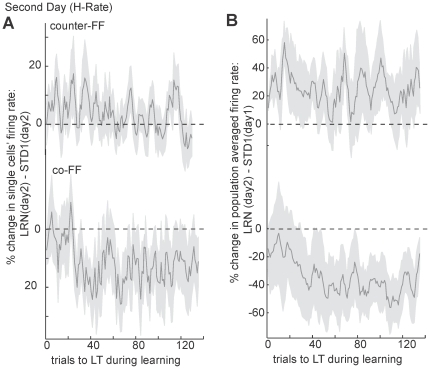
Figure 6. Neuronal activity during the second day of H-rate practice schedule.
Figure depicts analyses of cells with PDs in the range −135°<nPD<−45° (counter-FF, top) and range 45°<nPD<135° (co-FF, bottom). (A) Percent of change in single cells firing rate along force-field trials from standard trials to the learned target (LT) show non-significant changes in activity of counter-FF cells (upper trace) but a significant decrease of activity in co-FF cells (bottom trace). Number of cells = 31; shaded areas denote SEM. (B) Percent of change in the averaged firing rates across counter-FF and co-FF cells as compared to the averaged firing rate of cells with PDs in the same range during pre-learning standard trials of day1. The plot shows that counter-FF cells maintain their increased activity, while activity co-FF cells is initially similar to standard and only later decreases. Data includes 4 learning sets. Shaded areas denote SEM.

