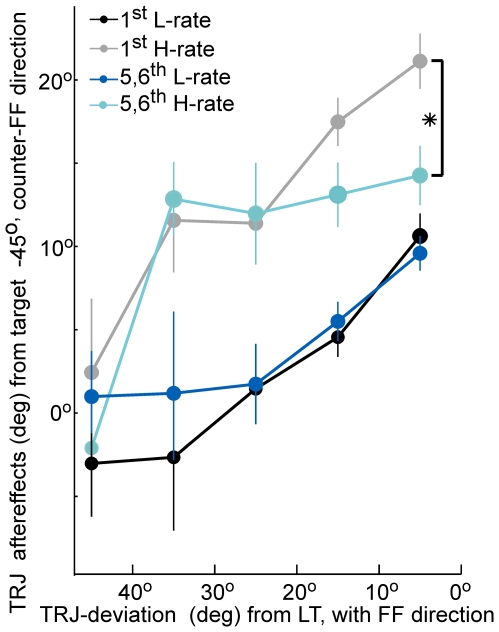
Figure 9. The generalization effect under H-rate is larger than under L-rate but more labile.
The figure depicts the trajectory aftereffects (no force-field) to the target at −45° as a function of the trajectory deviations to the learned target under the force-field (in bins of 10°) for trials that immediately followed a force-field trial (1st-trials, L-rate in black, H-rate in grey) and aftereffects after 5–6 trials (5,6th-trials, L-rate in blue, H-rate in cyan). Note that for any directional deviation from the learned target smaller than 40°, the immediate aftereffects under H-rate (grey) were significantly larger than under L-rate (black). However, note also that under H-rate the large aftereffects significantly decay within 5 trials (asterisk), while under L-rate they do not show such decay. Error bars denote SEM. Asterisks denote 1% significance.

