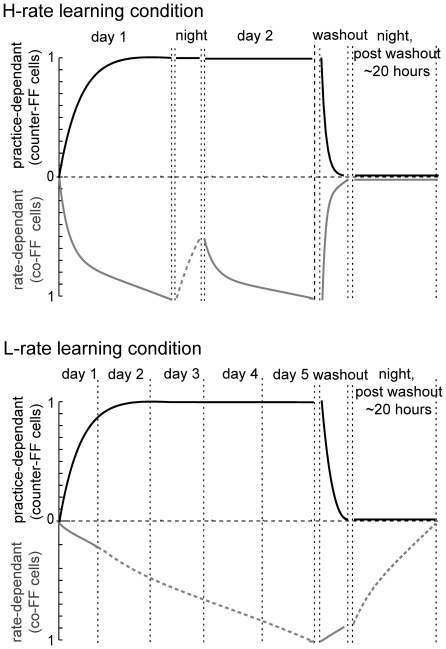
Figure 10. A qualitative scheme of the schedule-dependent and practice-dependant neuronal processes can account for the observed behavioral changes during learning.
The evolvement of the practice-dependent process that reflects the observed dynamics of counter-FF cells (black) and the schedule-dependent process reflecting the co-FF cells (grey). The scale is set arbitrarily from zero to one to represent a transfer from a naive state to a fully adapted state. The behavior reaches plateau only when the two processes reach one. Solid lines are based on observed results and dashed lines - speculations. During H-rate (upper plots) both processes reach the value of one on the first day. An “overnight drop” in the value of the schedule-dependent process re-emerged on the second day, corresponding to the observed overnight drop in performance (as in Figure 3A) and the change of only the co-FF cells in the second day (as in Figure 6). The washout results in a reversed change (as in Figure 5B) of both processes to zero, reflecting the diminishing aftereffects (as in Figure 3C). During the L-rate (bottom plots), the practice-dependent process evolved as in the H-rate, but it took more time, since trials appeared at a lower rate. The development of the schedule-dependent process was slower. The curve is only speculative to illustrate the slow development. The washout in the L-rate reversed only the practice-dependent process (as in Figure 5B, black). We assume that the schedule-dependent process was reversed overnight since the observed results did not show aftereffects on the following day.

