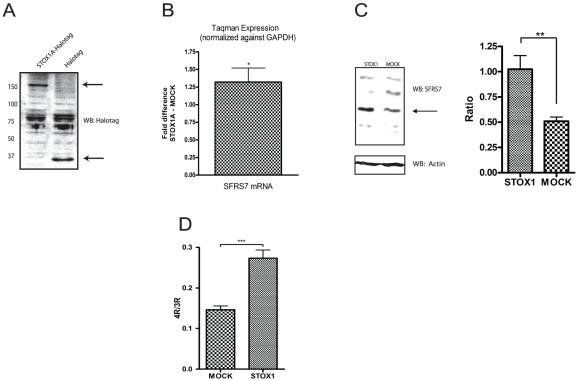
Figure 2. STOX1A-induced SFRS7 expression is followed by increased tau splicing in SK-N-SH cells.
(A) Expression of STOX1A protein was determined with an anti-Halotag specific antibody by western blot using total cell protein extracts obtained from stable STOX1A (left lane) and MOCK (right lane) transfected SK-N-SH cells. A specific band representing STOX1A-halotag protein was observed at its expected size of 150 kd. Halotag protein (MOCK) was detected at its expected size of 34 kd. Westernblot image is a representative of at least 3 independent experiments. (B) Quantitative RT-PCR data shows a mean 1.32 fold (mean ΔΔCt is −0,4) increased mRNA expression for SFRS7. Bars are mean ± SEM. * indicate P<0.05 (one sample t-test with theoretical mean 0). N = 4, each sample was measured in triplicate. (C, left image) Expression of endogenous SFRS7 protein was determined with an SFRS7 specific antibody by western blot using total cell protein extracts obtained from stable STOX1A and MOCK transfected SK-N-SH cells. An antibody specific for actin was used as a loading control. (C, right graph) Quantification of SFRS7 protein was performed using densitometry. The ratio number of obtained band intensities for STOX1A divided by actin was compared to the ratio number of obtained band intensities for MOCK divided by actin for 3 independent experiments. A significant increase for the STOX1A ratio number was found compared to the MOCK ratio number. P-values were calculated using two-tailed unpaired t-test, error bars represent ± SEM, ** indicate P<0.01. (D) Ratio numbers were obtained by dividing endogenous 4R and 3R tau mRNA concentrations for SK-N-SH cells stably transfected with STOX1A or MOCK constructs. Endogenous 4R and 3R mRNA concentrations were obtained as described in the material and methods section. A highly significant increase of the 4R/3R tau ratio was seen for STOX1A compared to MOCK transfected cells. P-values were calculated using two-tailed unpaired t-test, error bars represent ± SEM, *** indicate P<0.001. N = 4, each sample was measured in triplicate.

