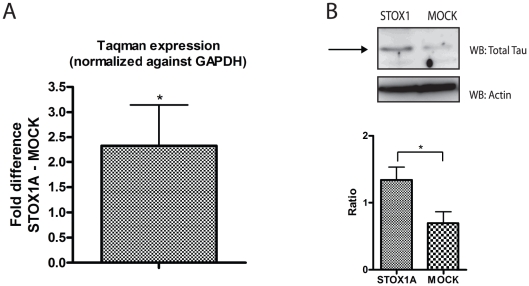
Figure 8. STOX1A effectuates endogenous total tau expression in U-373 MG cells.
(A) Quantitative RT-PCR show a mean 2,33 fold (mean ΔΔCt is −1,22) increased mRNA expression for total tau. Bars are mean ± SEM. * indicate P<0.05 (one sample t-test with theoretical mean 0). N = 4, each sample was measured in triplicate. (B) Expression of endogenous total tau protein was determined with a total tau specific antibody by western blot using total cell protein extracts obtained from STOX1A and MOCK transfected U-373 MG cells. An antibody specific for actin was used as a loading control. Westernblot image is a representative of at least 3 independent experiments. (B, lower graph) Quantification of total tau protein was performed using densitometry. The ratio number of obtained band intensities for STOX1A divided by actin was compared to the ratio number of obtained band intensities for MOCK divided by actin for 3 independent experiments. A significant increase for the STOX1A ratio number was found compared to the MOCK ratio number. P-values were calculated using two-tailed unpaired t-test, error bars represent ± SEM, *** indicate P<0.001.

