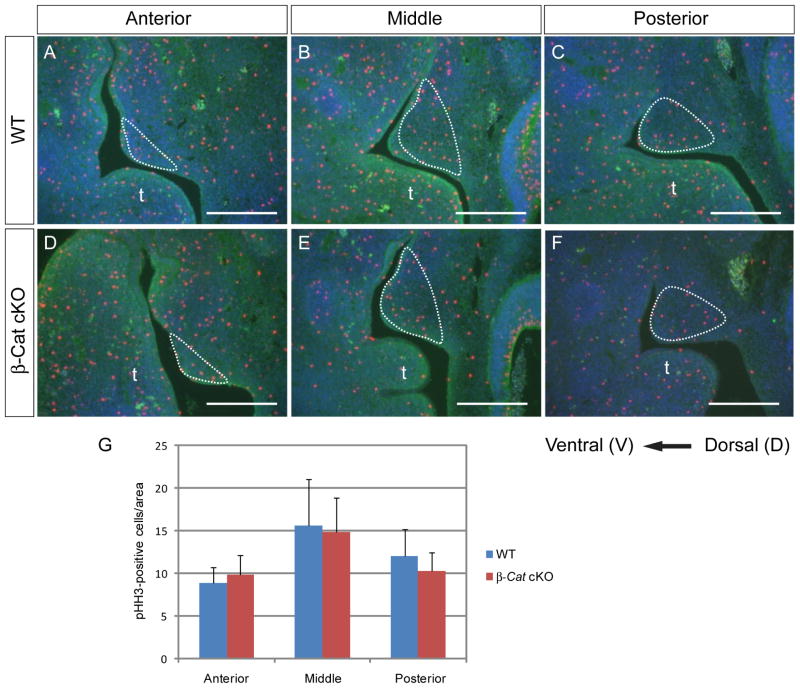
Fig. 4.
Cell proliferation in control and β-Catenin cKO palatal shelves. (A–F) PHH3 staining on anterior (A, D), middle (B, E) and posterior (C, F) palatal shelves of WT (A–C) and β-Catenin-cKO palates (D–F) showed no difference in proliferation rate (n=8) (G). The palatal region was highlighted and the position of tongue (t) was indicated in the figure. Scale bars: 0.25mm

